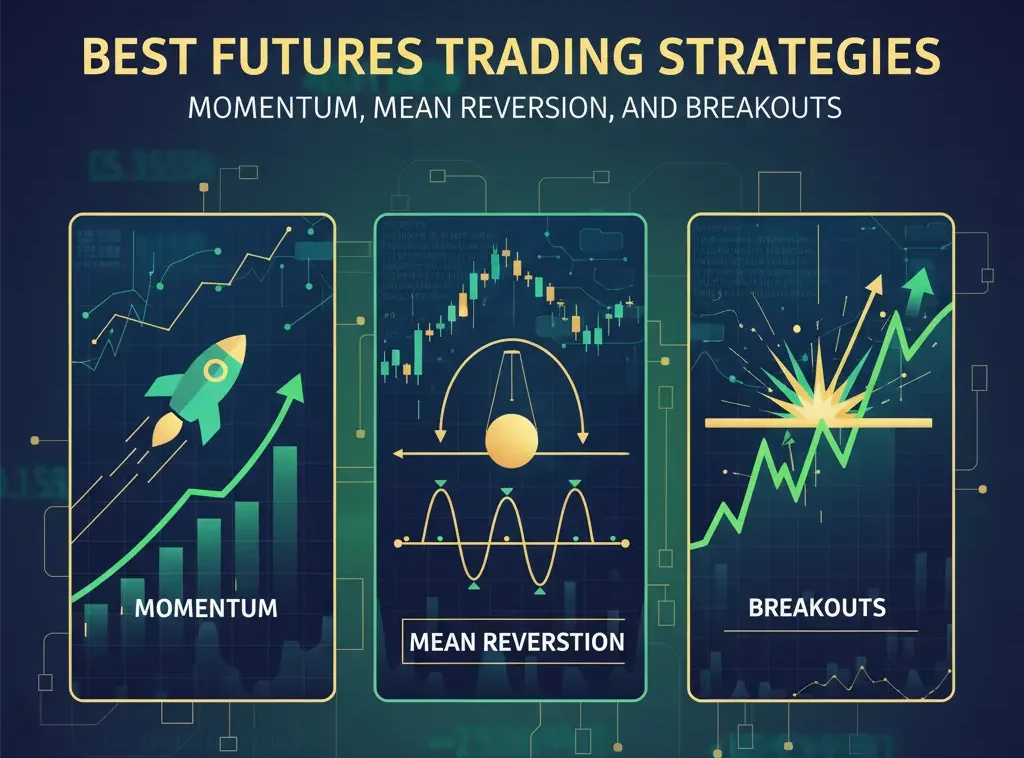
Mean Reversion in Futures: Indicators, Entries, and Exits
Futures markets are defined by their volatility, creating powerful trends but also significant price oscillations. While many traders focus on riding trends, a powerful alternative exists in capitalizing on the market’s tendency to correct itself. This is the core of a mean reversion strategy, a systematic approach built on the theory that asset prices, after making an extreme move, will eventually return to their long-term average. For traders of all levels, from beginners seeking structure to advanced quants developing complex models, understanding mean reversion provides a robust framework for identifying high-probability opportunities in non-trending markets. This guide will demystify the core concepts, from essential indicators to precise entry and exit protocols, offering a complete roadmap for implementation.
What Is a Mean Reversion Strategy?
At its heart, a mean reversion strategy operates on a simple statistical principle: extreme events are rare, and prices tend to gravitate toward their historical average over time. Think of it like a stretched rubber band—the further you pull it, the stronger the force pulling it back to its resting state. In trading, the « mean » can be defined in several ways, but it’s most commonly represented by a moving average (e.g., a 20-period or 50-period Simple Moving Average). When a futures contract’s price spikes far above or collapses far below this moving average, mean reversion traders see an overextension. They anticipate that the emotional buying or selling frenzy will subside, and the price will « revert » back toward this equilibrium level. This approach is fundamentally different from trend-following, as it seeks to profit from the end of a short-term move, not its continuation. It thrives in markets that are consolidating, range-bound, or choppy, where clear directional momentum is absent.
A 5-Step Guide to Trading Mean Reversion
Executing a mean reversion strategy requires a disciplined, rules-based approach to avoid mistaking a new trend for a temporary deviation. Traders across experience levels can adapt this framework, increasing complexity as their skills grow. For beginners, the focus should be on clear, visual signals. Advanced traders may incorporate statistical measures like standard deviation or z-scores.
- Define the ‘Mean’: The first step is to establish your baseline for the average price. A 20-period Simple Moving Average (SMA) is a common starting point for intraday charts. This line represents the current equilibrium or « fair value. »
- Identify a Significant Deviation: Observe when the price moves significantly away from the SMA. This isn’t just any small fluctuation; it should be a notable extension. Tools like Bollinger Bands are excellent for this, as a touch of the upper or lower band objectively signals a statistical extreme.
- Seek Confirmation with a Momentum Indicator: An extended price alone isn’t a sufficient entry signal. You need evidence that momentum is fading. An oversold reading on the Relative Strength Index (RSI) (below 30) or a Stochastic Oscillator can confirm that selling pressure is exhausted, making a snap-back more likely. Conversely, an overbought reading (above 70) signals fading buying pressure.
- Execute the Trade: Once you have a deviation and momentum confirmation, you can enter the trade. For a long entry (buying), this would be when the price is far below the SMA and RSI is oversold. For a short entry (selling), price would be far above the SMA with an overbought RSI.
- Set Clear Exit Targets: A mean reversion trade has two logical exit points. The primary profit target is the moving average itself—the « mean » you expect the price to revert to. A stop-loss should be placed just beyond the recent extreme price high or low to protect against the possibility that you’ve misjudged the move and a new, powerful trend is actually beginning.
Essential Tools & Platform Indicators
Modern trading platforms offer a suite of indicators perfect for a mean reversion strategy. While countless options exist, mastering a few core tools is more effective than cycling through dozens. Beginners should start with the first two, while intermediate and advanced traders can incorporate oscillators and volume analysis for more nuanced signals. Many of these tools are standard in platforms like NinjaTrader and TradingView.
Key Indicators for Your Charts:
- Bollinger Bands: This is arguably the most critical mean reversion indicator. It consists of a middle band (a 20-period SMA) and two outer bands set at two standard deviations away. When price touches or breaches an outer band, it’s statistically overextended and likely to revert to the middle band. The bands also dynamically measure volatility, widening in active markets and tightening in quiet ones.
- Relative Strength Index (RSI): This momentum oscillator measures the speed and change of price movements on a scale of 0 to 100. A reading above 70 is considered « overbought » and a candidate for a short (sell) trade, while a reading below 30 is « oversold » and a candidate for a long (buy) trade. It’s an excellent confirmation tool to use with Bollinger Bands.
- Stochastic Oscillator: Similar to the RSI, this indicator compares a security’s closing price to its price range over a given period. It provides overbought (above 80) and oversold (below 20) readings, helping to time entries when momentum is waning.
- Volume Profile: Advanced traders can use volume analysis to enhance their strategy. A key concept we explore is the Volume Profile Analysis in Futures. If price extends into a low-volume node on the profile, the reversal is often quicker and more aggressive, as there is little support or resistance to hold it there.
Practical Strategy Examples in Futures
Theory is one thing, but application is what matters. Here are two common scenarios where a mean reversion strategy can be applied in the futures markets, tailored for different trader profiles. Remember, no strategy is foolproof; these are frameworks for identifying opportunities.
Example 1: Beginner – The Bollinger Band Fade (ES E-mini S&P 500)
An entry-level trader watches the E-mini S&P 500 (ES) futures on a 15-minute chart. The market is in a sideways consolidation. The price suddenly drops and touches the lower Bollinger Band. The trader waits for confirmation and sees the 14-period RSI dip below 30. This confirms oversold conditions.
- Entry: Go long (buy) one contract as the candle closes back inside the lower band.
- Stop-Loss: Place a stop-loss just below the low of the candle that touched the band.
- Profit Target: Set a take-profit order at the 20-period moving average (the middle Bollinger Band).
- Pros: Simple, visual, and provides clear entry and exit points. Great for disciplined beginners.
- Cons: Can lead to losses if a strong downtrend begins unexpectedly.
Example 2: Advanced – Statistical Arbitrage (Crude Oil Pairs Trade)
An advanced trader identifies a strong historical correlation between WTI Crude Oil (CL) and Brent Crude Oil (BRENT). Using a custom script, they chart the price spread between the two contracts. For weeks, the spread has oscillated around an average of $5.00. A geopolitical event causes Brent to rally much faster than WTI, and the spread widens to $8.00, a 3-standard-deviation event. This is a prime candidate for statistical arbitrage, a quantitative form of mean reversion.
- Entry: Short BRENT futures and simultaneously go long CL futures, in a dollar-neutral ratio.
- Stop-Loss: A stop is placed if the spread widens to $9.50 (a 4-standard-deviation move), indicating a potential structural shift in the market relationship.
- Profit Target: The position is closed when the spread reverts to its mean of $5.00.
- Pros: Market-neutral (less dependent on overall market direction) and based on robust statistical relationships.
- Cons: Requires more sophisticated tools, understanding of correlation, and access to multiple markets.
Risk Management and Common Mistakes
The single greatest danger in a mean reversion strategy is fighting a strong trend. What looks like an overextended price can always become *more* overextended. Without disciplined risk management, a series of small wins can be wiped out by one trade that goes horribly wrong. For every trader, from novice to expert, managing this risk is paramount.
Common Mistakes to Avoid:
- Ignoring Market Context: Trying to fade a strong, news-driven trend is a recipe for disaster. If the market is clearly trending on higher timeframes, short-term mean reversion signals are less reliable. Always check the daily or 4-hour chart for context.
- Not Using a Stop-Loss: This is non-negotiable. A trader might think, « It has to come back eventually. » It doesn’t. A stop-loss is your protection against a fundamental market shift that invalidates your trade thesis.
- Averaging Down Into a Losing Trade: Adding to a losing position in the hope that the reversal is « just around the corner » is a catastrophic error. This compounds risk and can lead to a margin call. Stick to your initial position size and risk parameters.
- Setting Unrealistic Profit Targets: The goal is to capture the reversion to the mean, not to ride a new trend in the opposite direction. Taking profits at the moving average is a high-probability exit. Being greedy and holding for more can see the price rejoin the original trend, erasing your gains. For more on this, our guide on How to Set Realistic Profit Targets is an essential read.
The risk level of a mean reversion strategy is directly tied to the trader’s discipline in applying stop-losses.
Mean Reversion vs. Trend Following
Understanding the fundamental differences between mean reversion and trend following is crucial for traders to align a strategy with their personality and prevailing market conditions. One is not inherently better than the other; they are complementary tools for different environments. A successful trader often knows when to switch between these two mindsets.
| Criterion | Mean Reversion Strategy | Trend Following Strategy |
|---|---|---|
| Core Philosophy | Prices will revert to their historical average after extreme moves. « Buy low, sell high. » | Once a trend is established, it is likely to continue. « Buy high, sell higher. » |
| Optimal Market | Ranging, choppy, or consolidating markets with low directional momentum. | Strong, sustained directional markets (uptrends or downtrends). |
| Win Rate | Typically high (many small wins). | Typically low (many small losses, few large wins). |
| Risk Profile | Risk of a single large loss if a new trend begins (« catching a falling knife »). | Risk of many small losses during range-bound periods (« whipsaws »). |
| Key Indicators | Bollinger Bands, RSI, Stochastics. | Moving Averages (50/200 SMA), MACD, ADX. |
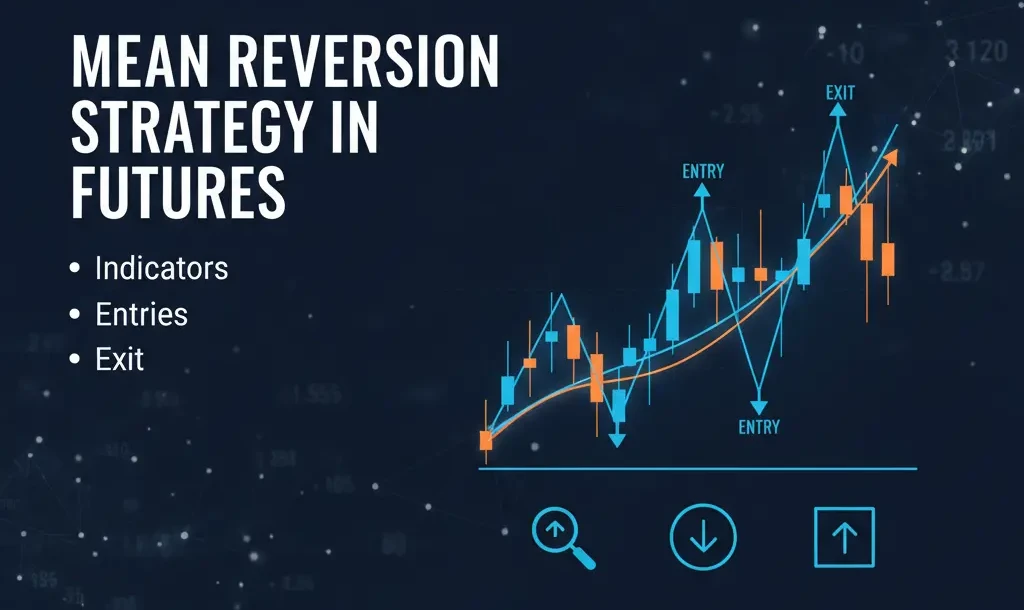
Visual Analysis: Reading Reversals on a Chart
A chart is the mean reversion trader’s canvas. The ability to visually identify points of unsustainable extension is a key skill. The following SVG chart illustrates a classic mean reversion setup in a hypothetical futures market. Notice how the price action interacts with the statistical bands and how momentum wanes at the extremes.
Key Takeaways
Distilling this comprehensive guide down to its core principles, traders should remember these critical points when developing or deploying a mean reversion strategy.
« The market is a pendulum that forever swings between unsustainable optimism and unjustified pessimism. » – Benjamin Graham
- Works Best in Ranging Markets: Mean reversion is not an all-weather strategy. It excels when there is no clear, dominant trend.
- Confirmation is Crucial: Never enter a trade based on price deviation alone. Always use a momentum indicator like RSI to confirm that the move is exhausted.
- Risk Management is Non-Negotiable: The biggest risk is fighting a new trend. A hard stop-loss is the only way to protect your capital from a catastrophic loss.
- The Mean is the Target: The primary goal is to profit from the snap-back to the average. Taking profits at the moving average is a disciplined and effective exit strategy.
- Start Simple: Beginner traders should master the Bollinger Band and RSI combination before moving on to more complex statistical arbitrage or order flow analysis techniques.
Frequently Asked Questions
Is mean reversion a good strategy for beginners?
Mean reversion can be suitable for beginners if they focus on highly liquid, range-bound markets and use simple indicators like Bollinger Bands. However, it requires strict risk management, as what appears to be a deviation from the mean could be the start of a strong new trend. Beginners must always use stop-losses and consult resources like the CFTC’s Investor Advisories for foundational knowledge.
What is the difference between mean reversion and trend following?
They are opposite approaches. Mean reversion strategies profit from the assumption that prices will return to an average after an extreme move. Trend following strategies assume that once a price starts moving in a direction, it will continue. Mean reversion works best in ranging or choppy markets, while trend following excels in sustained directional markets.
How does pairs trading relate to mean reversion?
Pairs trading is a classic example of a mean reversion strategy. It involves identifying two futures contracts that have a high historical correlation (e.g., WTI and Brent Crude Oil). When the price spread between them deviates significantly from its historical average, a trader would sell the outperforming contract and buy the underperforming one, betting that the spread will revert to its mean.
Which futures markets are best for a mean reversion strategy?
Markets that often exhibit range-bound behavior are typically good candidates. This includes major stock index futures like the ES (E-mini S&P 500) during periods of consolidation, certain currency futures, and Treasury futures like the ZN (10-Year T-Note). Highly volatile commodity markets can also offer opportunities, but the risk is greater.
Conclusion: Is Mean Reversion Right for You?
The mean reversion strategy offers a compelling, systematic alternative to trend following, providing traders with a powerful toolkit for non-directional markets. By leveraging statistical principles and robust technical indicators like Bollinger Bands and RSI, traders of all levels can identify and act on high-probability reversal opportunities. Its success hinges not on predicting the future but on the reliable market tendency for prices to correct overextensions. However, this strategy is not a passive endeavor. It demands unwavering discipline in risk management, a keen awareness of market context, and the humility to accept when a trade is wrong. For those who appreciate structure, rules, and exploiting market psychology, mastering the art of mean reversion can be a highly rewarding component of a comprehensive trading plan. To take your analysis to the next level, consider exploring how to integrate these concepts with a guide to mastering the footprint chart.