What Is Market Microstructure Trading?
Market microstructure trading is all about the mechanics behind every tick on your chart. It digs into how orders are placed, executed, and influence price movements—focusing on the rules, participants, and technology that power the market’s “plumbing”. Instead of just reacting to price, microstructure traders analyze:
- Order flow: The sequence and size of buy/sell orders
- Liquidity: How easily assets can be traded without major price changes
- Bid-ask spread: The gap between what buyers will pay and sellers will accept
- Price discovery: How the true market price emerges from supply and demand
This approach isn’t just for quants and pros—retail traders who understand microstructure can spot opportunities before the crowd.
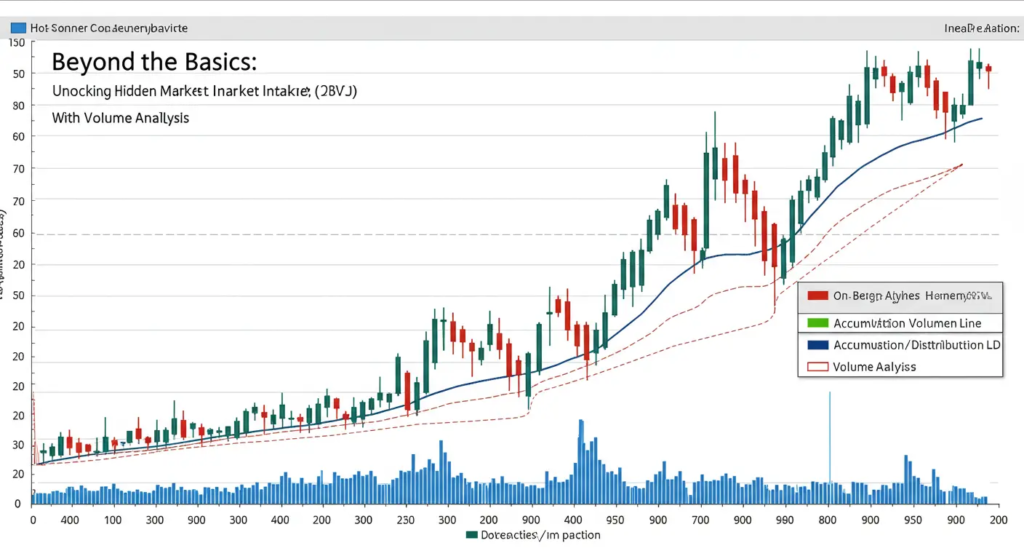
Beyond the Candlesticks – The Real Game of the Market
As experienced traders, we’ve all mastered the art of reading charts. We see trends, support, resistance, and candlestick patterns. But this is like watching a play from the audience; we see the actors’ movements, but we don’t always understand the script or the director’s true intentions. To gain a genuine edge, we must go backstage. This is the realm of market microstructure trading.
Market microstructure is the study of how markets actually function: how trades are executed, how liquidity is provided, and how information is processed. It’s the « why » behind the « what » of price movement. And the single most powerful tool for unmasking these hidden dynamics is volume.
At Volume Power System, we believe that understanding the constant battle between supply and demand at a micro level is the key to anticipating major market shifts. This article will show you how to use volume as an x-ray, revealing the market imbalances that Smart Money exploits, and how the VPS framework turns this insight into a powerful trading strategy.
Price is the Result, Volume is the Force
A fundamental shift in perspective is required for advanced trading: Price movement is merely the result of an imbalance between supply and demand. Volume, however, measures the force of that battle.
A price can move up for two reasons:
- An overwhelming surge of aggressive buying (strong demand).
- A simple lack of sellers (weak supply).
These two scenarios look identical on a price-only chart, but they are profoundly different from a market microstructure perspective. The first scenario is a high-conviction move backed by institutional trading; the second is a weak, unreliable drift. Only by analyzing volume can we tell them apart.
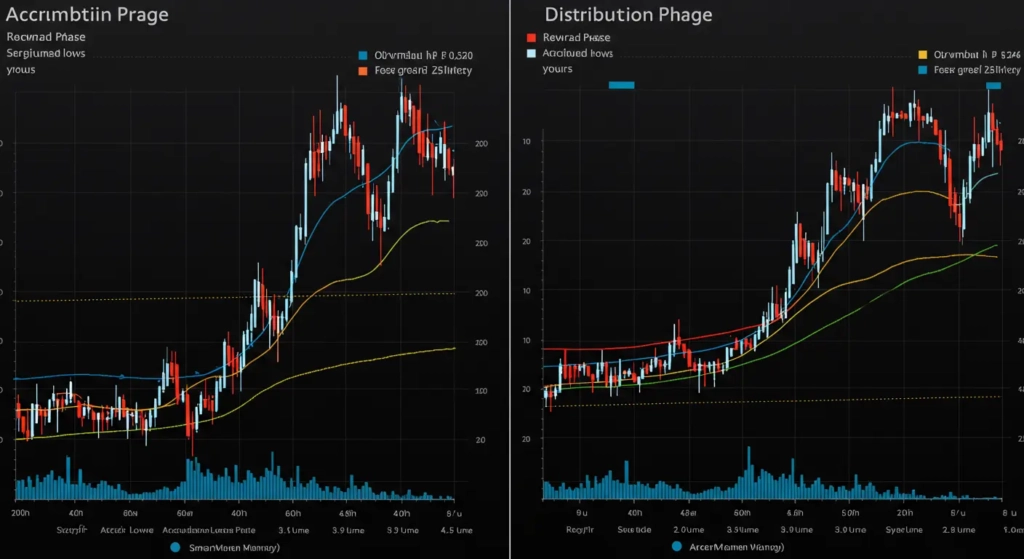
Identifying Demand Imbalances: Spotting Institutional Absorption
A demand imbalance occurs when strong, aggressive buying pressure absorbs all available selling pressure at a specific price level or zone. This is often the signature of Smart Money conducting volume accumulation.
How to spot this with volume:
- Price Action: The market is in a downtrend or a consolidation. Price attempts to move lower but repeatedly fails, often forming long lower shadows (wicks) on candlesticks like Hammers or Dojis.
- The Volume Signature (The VPS Edge):
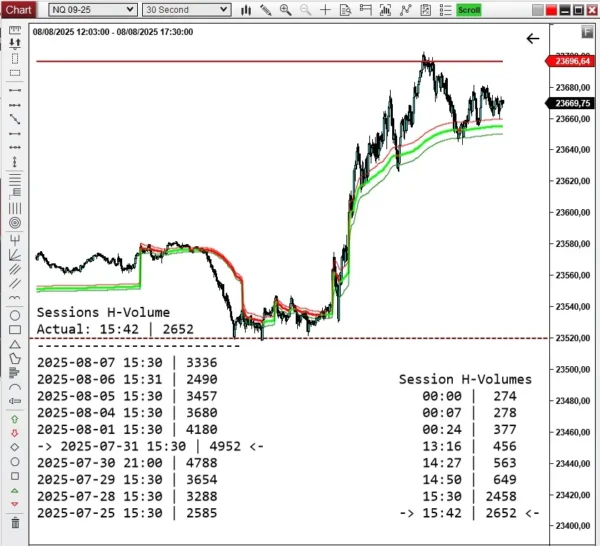
- High Volume on Rejections: Those rejection candles at the lows are accompanied by unusually high volume. This is counter-intuitive to many. Why high volume if the price didn’t go down? Because it represents a fierce battle where every sell order was met and absorbed by a larger buy order. This is liquidity analysis in action – someone with deep pockets is defending that level.
- Decreasing Volume on Further Tests: After an initial high-volume rejection, subsequent attempts to test the lows are often met with decreasing volume. This is a critical sign that the selling supply has been exhausted. The Smart Money has finished buying.
This entire process reveals a clear demand imbalance. Supply is weak, demand is strong, and the market is being primed for a significant move higher.
Identifying Supply Imbalances: Uncovering Stealth Distribution
Conversely, a supply imbalance occurs when aggressive selling pressure overwhelms all available buying pressure. This is how Smart Money executes volume distribution at market tops, selling their large positions to enthusiastic but less-informed buyers.
How to spot this with volume:
- Price Action: The market is in an uptrend or a topping range. Price attempts to move higher but struggles, often forming candles with long upper shadows like Shooting Stars.
- The Volume Signature (The VPS Edge):
- High Volume on Failed Rallies: The candles that fail to hold their highs are accompanied by significant spikes in volume. This indicates that every wave of buying enthusiasm was met with an even larger wave of institutional selling.
- Decreasing Volume on Rallies: As the distribution phase continues, attempts to rally higher often occur on declining volume. This signals that the genuine buying demand is drying up, and the Smart Money is in control.
This reveals a clear supply imbalance. Demand is weakening, supply is dominant, and the market is vulnerable to a sharp decline.
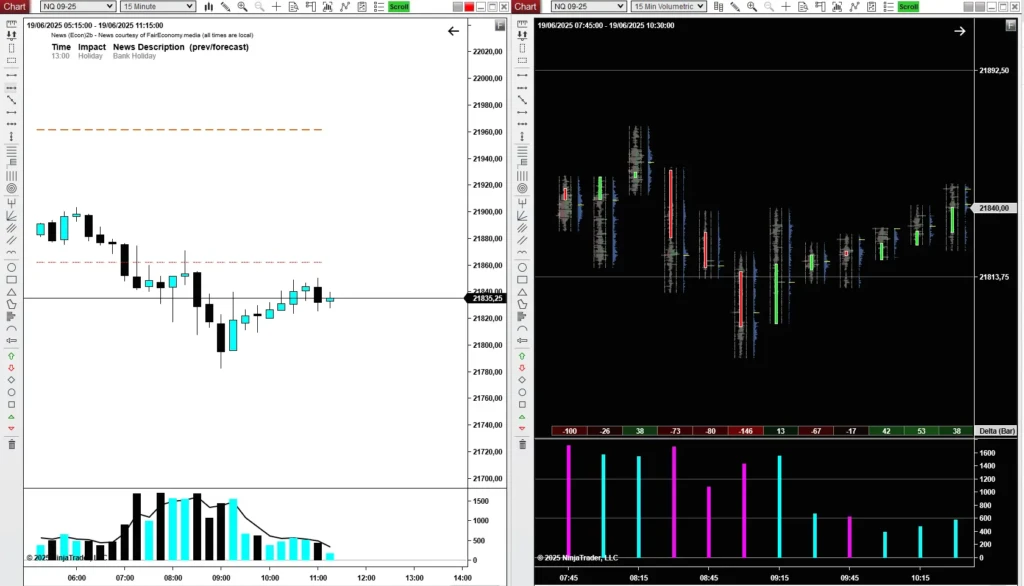
Deepening the Analysis: Order Flow and Volume Profile
For the ultimate market microstructure trading approach, the VPS framework integrates concepts from order flow and Volume Profile:
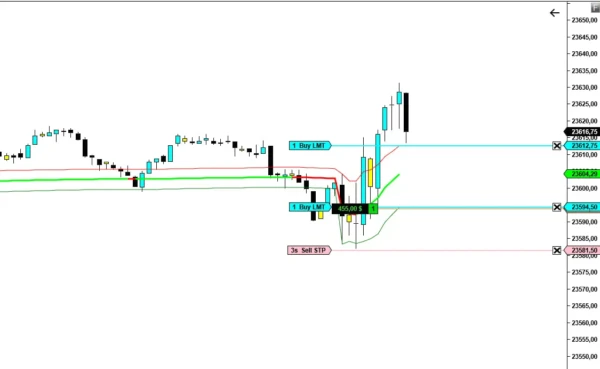
- Order Flow: This provides a granular view of how the volume was executed. Was that high volume spike caused by aggressive market buy orders or passive limit sell orders? Order flow analysis can confirm whether a volume spike at a low was due to genuine absorption by buyers or sellers aggressively hitting bids.
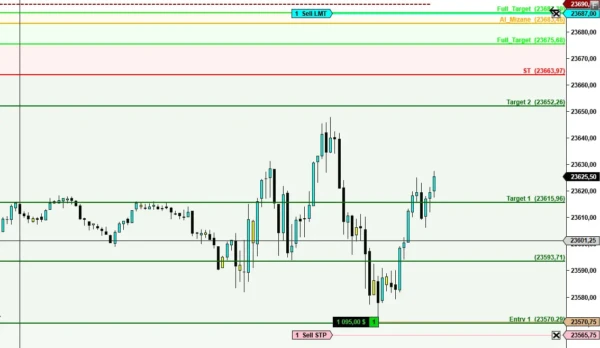
- Volume Profile: This shows where the volume was traded. A supply or demand imbalance confirmed by high volume at a significant Volume Profile level (like a High Volume Node or Value Area High/Low) becomes an exceptionally high-probability signal.
The Volume Power System teaches you how to create a confluence of these signals: a reversal candlestick pattern, at a key Volume Profile level, confirmed by a volume spike that is validated by aggressive order flow. This is the pinnacle of conviction.
Conclusion: Trade the Cause, Not Just the Effect
Stop being a trader who only reacts to price. By adopting a market microstructure trading mindset, you begin to trade the cause of price movement: the underlying imbalances between supply and demand.
Volume is the most honest indicator on your chart. It reveals the force, conviction, and strategic maneuvering of Smart Money. The Volume Power System provides you with a systematic framework to read this language fluently, allowing you to identify critical turning points long before the rest of the market catches on. This is not just another strategy; it’s a fundamental shift in perspective that aligns your trading with the true forces that drive the market.
FAQ Market Microstructure Trading
How the Volume Power System Leverages Market Microstructure Trading to Identify Supply and Demand Shifts ?
The Volume Power System is designed to exploit the principles of market microstructure trading by closely analyzing volume, order flow, and liquidity to pinpoint real-time shifts in supply and demand.
Here’s how it works:
Order Flow and Volume Analysis:
The system continuously monitors the flow and size of buy and sell orders. In market microstructure, order flow is highly persistent and often exhibits long-memory characteristics, meaning that large orders are typically executed incrementally over time to minimize market impact. By tracking these patterns, the Volume Power System can detect when there is a significant imbalance between buying and selling pressure, signaling a shift in supply or demand1.
Liquidity and Order Book Dynamics:
The system evaluates the depth and shape of the order book, including the bid-ask spread and available liquidity at different price levels. When liquidity is low, even modest orders can move prices, while high liquidity can absorb larger trades with minimal impact. The Volume Power System identifies areas where liquidity is thin or where large volumes are being absorbed, which often precedes major price movements driven by supply or demand shocks15.
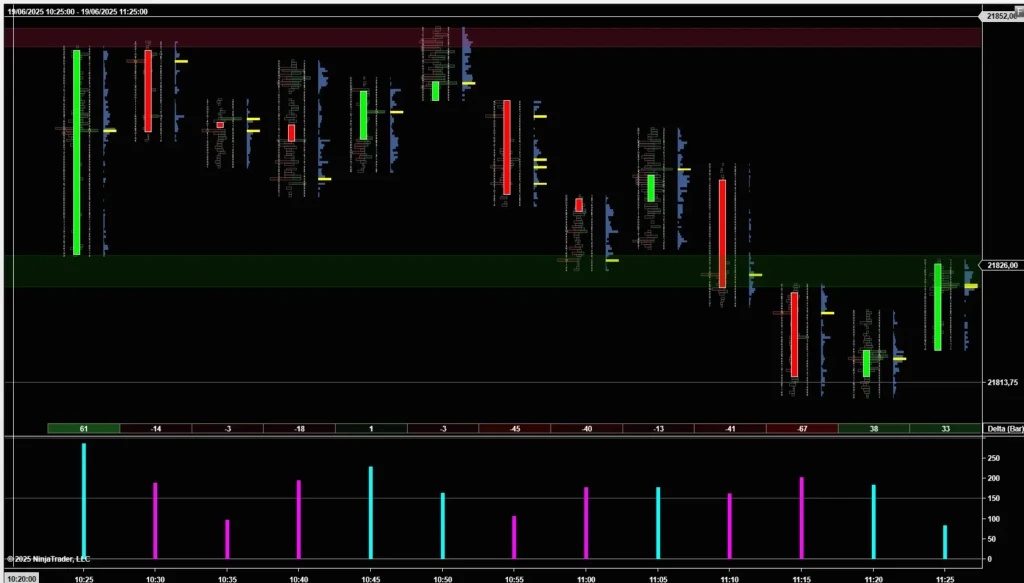
Volume Profile and Market Behavior:
By constructing a volume profile, the system highlights price levels where significant trading activity has occurred. These zones often act as support or resistance and indicate where market participants are most interested in transacting. A surge in volume at a particular price level can reveal a shift in market consensus, reflecting changes in supply and demand dynamics4.
Real-time Detection of Imbalances:
The system uses real-time data to alert traders when aggressive buying or selling is overwhelming the other side of the market. These imbalances are crucial for identifying potential trend reversals or breakouts, as they show where the market is digesting new information or reacting to large institutional orders.
Why This Matters:
Market microstructure theory shows that most price changes are the result of supply and demand imbalances rather than external news. By focusing on the actual transactions and volume—rather than just price—the Volume Power System provides a more nuanced and actionable view of market dynamics, allowing traders to anticipate and capitalize on shifts before they are reflected in price alone.
In summary, the Volume Power System leverages the core concepts of market microstructure trading—order flow, liquidity, and volume analysis—to expose hidden supply and demand shifts, giving traders a powerful real-time edge in any market.
How does the Volume Power System interpret persistent order flow patterns to detect supply and demand changes ?
The Volume Power System leverages persistent order flow patterns by analyzing the continuous sequence and direction of buy and sell orders, which are fundamental to market microstructure trading. Here’s how it interprets these patterns to identify shifts in supply and demand:
Detecting Order Flow Direction and Persistence:
Order flow represents the real-time stream of market orders—buys and sells—that reveal the intentions of market participants. Persistent order flow, such as a sustained sequence of buy orders, signals consistent demand, while a string of sell orders indicates ongoing supply. By monitoring these patterns, the Volume Power System can distinguish between random market noise and genuine shifts in sentiment.
Volume and Order Flow Synergy:
The system combines real-time order flow with historical volume data. When persistent buying is accompanied by rising volume, it suggests strong demand that could push prices higher. Conversely, persistent selling with increasing volume points to growing supply and potential price declines. This synergy helps validate whether a price move is supported by actual market participation or is likely to fade.
Identifying Market Imbalances:
By tracking the persistence and size of order flows, the system can spot when buying or selling pressure is overwhelming the other side of the market. This imbalance is a key indicator of supply and demand shifts, often preceding significant price changes. For example, a prolonged surge in aggressive buy orders at a specific price level, especially with high volume, may signal the exhaustion of supply and the start of a new uptrend3.
Volume Profile and Support/Resistance:
The Volume Power System uses volume profile analysis to highlight price levels with substantial trading activity. When persistent order flow aligns with these high-volume zones, it provides further confirmation of supply or demand changes—these levels often act as support or resistance, reinforcing the system’s signal.
Real-Time Alerts for Shifts:
The system continuously scans for persistent order flow patterns and issues real-time alerts when it detects significant shifts. This allows traders to react quickly to emerging supply and demand imbalances, capitalizing on market moves as they develop3.
In summary, the Volume Power System interprets persistent order flow patterns by integrating them with volume and liquidity analysis. This approach provides a clear, actionable view of supply and demand dynamics, enabling traders to anticipate and respond to market shifts with greater precision.
Ready to move beyond surface-level analysis and master the art of market microstructure?
GET YOUR COPY OF « VOLUME POWER SYSTEM » NOW!
-
Volume Power System VE
Le prix initial était : $ 250,00.$ 199,00Le prix actuel est : $ 199,00. -
VPS Conviction Monitor: Instantly Spot Institutional Activity and Market Turning Points
Le prix initial était : $ 90,00.$ 57,00Le prix actuel est : $ 57,00. -
VPS Dynamic VWAP: The Professional’s Edge for Identifying True Market Value
Le prix initial était : $ 100,00.$ 57,00Le prix actuel est : $ 57,00. -
VPS Ignition Zone: The Ultimate System for Pinpointing High-Precision Entries & Exits
Le prix initial était : $ 80,00.$ 47,00Le prix actuel est : $ 47,00.